Functionality Analysis
Functionality Analysis of Buildings is performed by combining the physical damage outcomes of buildings and electrical serviceability. Following steps are needed.
Estimate physical damage to buildings: 0: Damage State [‘None’,’Slight’, ‘Moderate’] is operable 1: Damage State [‘Extensive’,’Complete’] is non-operable
Estimate damage to electrical poles: 0: Non Failure 1: Failure
Identify the serviceability area of the electrical network using Voronoi polygons. This process requires geospatial analysis using Geographic Information Systems (GIS). Voronoi polygons are created to determine the service area of each electrical pole. Buildings fall within a specific Voronoi polygon, receiving electricity from the corresponding pole. Once the damage or serviceability status of an electrical pole is known, geospatial analysis can determine the serviceability (0: No Service, 1: Service Active) of electrical power.
Combine operability of buildings and serviceability of electrical poles to determine the functionality of buildings. Fully Functional: Building is operable (1) and electrical service is active (1) Partially Functional: Building is operable (1) but no electrical service (0) Non Functional: Building is non-operable (0) and [lectrical service is active (1) or no electrical service (0)]
Following is an example of estimating voronoi polygons service area:
Step 1: Conducting Voronoi analysis in QGIS (this can be done using other tools):

1. **Prepare Data:** load EPN layer and ensure it's in a projected coordinate system.
2. **Open Processing Toolbox:** go to `Processing` > `Toolbox`.
3. **Generate Voronoi Polygons:** search for `Voronoi polygons` in the toolbox, select EPN layer as input, specify output settings (study area boundary), and run the tool.
4. **Connect Building to Voronoi Layer:** intersect building layer to voronoi layer to assign dependent voronoi service area and/or dependent electrical pole. 'vid' field in the building layer is obtained through this process and vid represents epn id, as well as voronoi id corresponds to a building
Following is an example of running functionality analysis - combining buildings and electrical poles:
Step 2: Combining buildings and electrical poles results:

# Building inventory with voronoi and damage info
building_dmg.head()

# Electrical poles damage result
result_epn = result_epn_damage[['id', 'dmg']].rename(columns={'dmg': 'dmg_epn','id':'id_epn'})

# Building Data - merging dmg to building invetory
blg_epn_results = pd.merge(building_dmg, result_epn, left_on='vid', right_on='id_epn')

# Calculate Functionality State: 'FS'
df_func = calculate_fs(blg_epn_results, 'dmg', 'dmg_epn')
Summary Damage
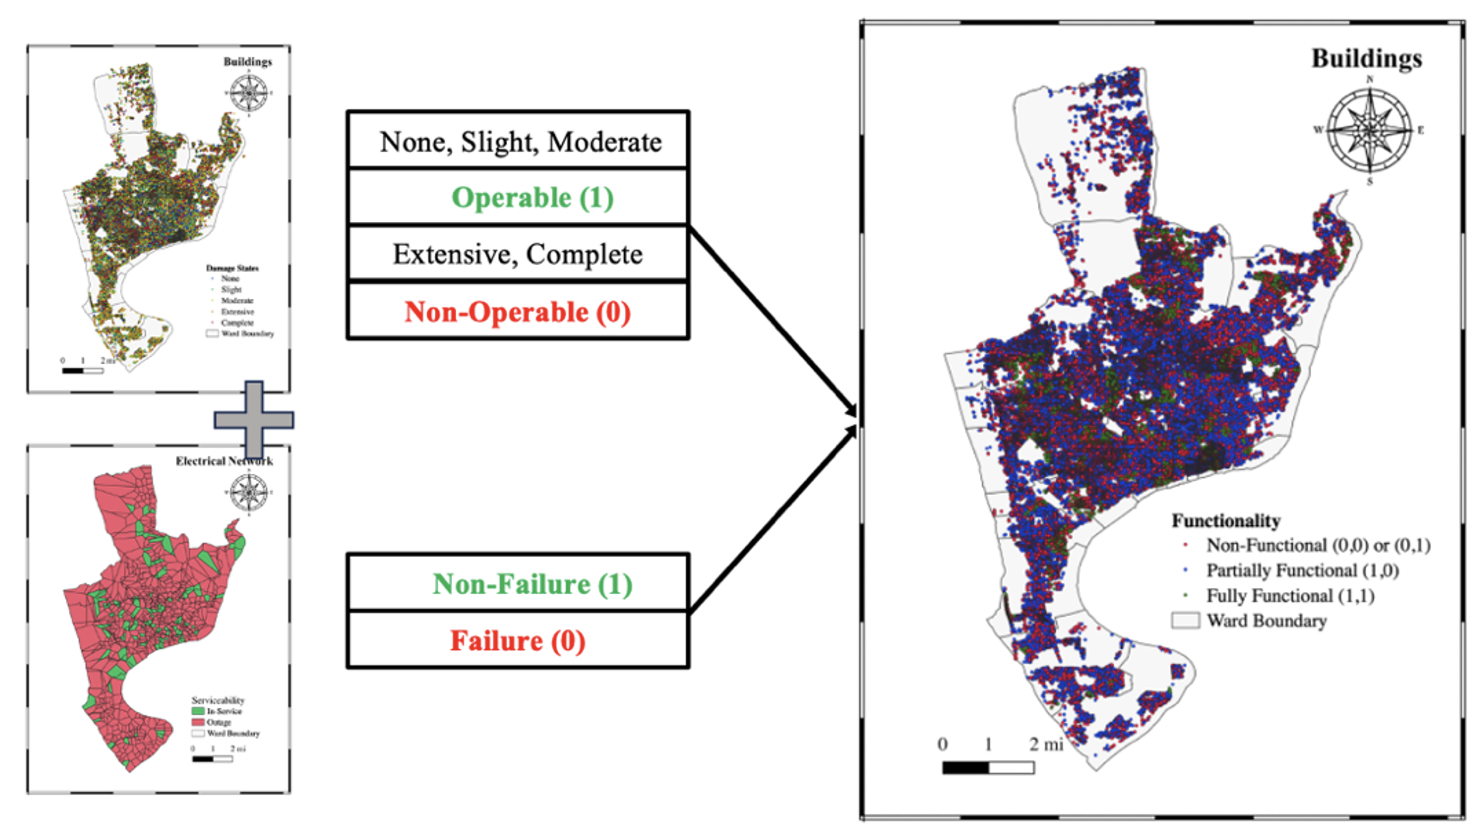
Fig 7. Functionality Analysis.
Social Impact Estimation
Social impacts are analyzed by connecting damage state outcomes with social characteristics by administrative boundaries. Population census data is a good source to estimate updated social characteristics. The number of household dislocations and the number of educational, governmental, and industrial buildings that are non-operable are estimated by connecting physical damage with household information. The number of housing units in a building in this study was estimated based on the building footprint and the number of floors. A residential building with an area greater than 300 square meters is assumed to have four households. Similarly, residential buildings with areas of 110, 195, and 300 square meters are assumed to have 1, 2, and 3 housing units, respectively.
Following is an example of running social impact analysis: